Follow the Data

A data driven blog

Archive for the category “Tools and Software”

Modelling tabular data with Google’s TabNet

Released in 2019, Google Research’s TabNet is claimed in a preprint manuscript to outperform existing methods on tabular data. How does it work and how can one try it?

Tabular data probably make up the majority of business data today. Think of things like retail transactions, click stream data, temperature and pressure sensors in factories, KYC information… the variety is endless.

In another post, I introduced CatBoost, one of my favorite methods for building prediction models on tabular data, and its neural network counterpart, NODE. But around the same time as the NODE manuscript came out, Google Research released a manuscript taking a totally different approach to tabular data modelling with neural networks. Whereas NODE mimics decision tree ensembles, Google’s proposed TabNet tries to build a new kind of architecture suitable for tabular data.

The paper describing the method is called TabNet: Attentive Interpretable Tabular Learning, which nicely summarizes what the authors are trying to do. The “Net” part tells us that it is a type of neural network, the “Attentive” part implies it is using an attention mechanism, it aims to be interpretable, and it is used for machine learning on tabular data.

How does it work?

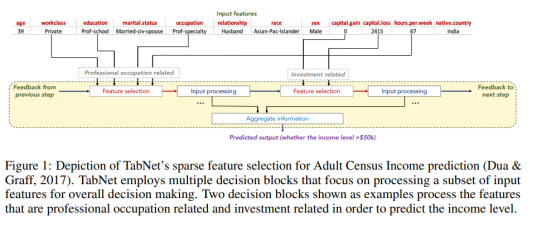
TabNet uses a kind of soft feature selection to focus on just the features that are important for the example at hand. This is accomplished through a sequential multi-step decision mechanism. That is, the input information is processed top-down in several steps. As the manuscript puts it, The idea of top-down attention in sequential form is inspired from its applications in processing visual and language data such as for visual question answering (Hudson & Manning, 2018) or in reinforcement learning (Mott et al., 2019) while searching for a small subset of relevant information in high dimensional input.

The building blocks for performing this sequential attention are called transformer blocks even though they are a bit different from the transformers used in popular NLP models such as BERT. The soft feature selection is accomplished by using the sparsemax function.

The first figure from the paper, reproduced below, sketches how information is aggregated to form a prediction.
Screenshot from 2020-01-13 21-55-05

One nice property of TabNet is that it does not require feature preprocessing (in contrast to e.g. NODE). Another one is that it has interpretability built in “for free” in that the most relevant features are selected for each example. This means that you don’t have to apply an external explanation module such as shap or LIME.

It is not so easy to wrap one’s head around what is happening inside this architecture when reading the paper, but luckily there is published code which clarifies things a bit and shows that it is not as complicated as you might think.

How can I use it?


The original code and modifications

As already mentioned, the code is available, and the authors show how to use it together with the forest covertype dataset. To facilitate this, they have provided three dataset-specific files: one file that downloads and prepares the data (download_prepare_covertype.py), another one that defines the appropriate Tensorflow Feature Columns and a CSV reader input function (data_helper_covertype.py), and the file that contains the training loop (experiment_covertype.py).

The repo README states:

To modify the experiment to other tabular datasets:

– Substitute the train.csv, val.csv, and test.csv files under “data/” directory,

– Modify the data_helper function with the numerical and categorical features of the new dataset,

– Reoptimize the TabNet hyperparameters for the new dataset.

After having gone through this process a couple of times with other datasets, I decided to write my own wrapper code to streamline the process. This code, which I must stress is a totally unofficial fork, is on GitHub.

In terms of the README points above:

  • Rather than making new train.csv, val.csv and test.csv files for each dataset, I preferred to read the entire dataset and do the splitting in-memory (as long as it is feasible, of course), so I wrote a new input function for Pandas in my code.
  • It can take a bit of work to modify the data_helper.py file, at least initially when you aren’t quite sure what it does and how the feature columns should be defined (this was certainly the case with me). There are also many parameters which need to be changed but which are in the main training loop file rather than the data helper file. In view of this, I also tried to generalize and streamline this process in my code.
  • I added some quick-and-dirty code for doing hyperparameter optimization, but so far only for classification.
  • It is also worth mentioning that the example code from the authors only shows how to do classification, not regression, so that extra code also has to be written by the user. I have added regression functionality with a simple mean squared error loss.

Using the command-line interface

Execute a command like:

python train_tabnet.py \
  --csv-path data/adult.csv \
  --target-name "<=50K" \
  --categorical-features workclass,education,marital.status,\
occupation,relationship,race,sex,native.country\
  --feature_dim 16 \
  --output_dim 16 \
  --batch-size 4096 \
  --virtual-batch-size 128 \
  --batch-momentum 0.98 \
  --gamma 1.5 \
  --n_steps 5 \
  --decay-every 2500 \
  --lambda-sparsity 0.0001 \
  --max-steps 7700

The mandatory parameters are — -csv-path(pointing to the location of the CSV file),--target-name(the name of the column with the prediction target) and--categorical-featues (a comma-separated list of the features that should be treated as categorical). The rest of the input parameters are hyperparameters that need to be optimized for each specific problem. The values shown above, though, are taken directly from the TabNet manuscript, so they have already been optimized for the Adult Census dataset by the authors.

By default, the training process will write information to the tflog subfolder of the location where you execute the script. You can point tensorboard at this folder to look at training and validation stats:

tensorboard --logdir tflog

and point your web browser to localhost:6006.

If you don’t have a GPU…

… you could try this Colaboratory notebook. Note that if you want to look at the Tensorboard logs, your best bet is probably to create a Google Storage bucket and have the script write the logs there. This is accomplished by using the tb-log-locationparameter. E.g. if your bucket’s name were camembert-skyscrape, you could add--tb-log-location gs://camembert-skyscraperto the invocation of the script. (Note, though, that you have to set the permissions for the storage bucket correctly. This can be a bit of a hassle.)

Then you can point tensorboard, from your own local computer, to that bucket:

tensorboard --logdir gs://camembert-skyscraper

Hyperparameter optimization

There is also a quick-and-dirty script for doing hyperparameter optimization in the repo (opt_tabnet.py). Again, an example is shown in the Colaboratory notebook. The script only works for classification so far, and it is worth noting that some training parameters are still hard-coded although they shouldn’t really be (for example, the patience parameter for early stopping [how many steps do you continue while the best validation accuracy does not improve].)

The parameters that are varied in the optimization script are N_steps, feature_dim, batch-momentum, gamma, lambda-sparsity. (output_dim is set to be equal to feature_dim, as suggested in the optimization tips just below.)

The paper has the following tips on hyperparameter optimization:

Most datasets yield the best results for N_steps ∈ [3, 10]. Typically, larger datasets and more complex tasks require a larger N_steps. A very high value of N_steps may suffer from overfitting and yield poor generalization.

Adjustment of the values of Nd [feature_dim] and Na [output_dim] is the most efficient way of obtaining a trade-off between performance and complexity. Nd = Na is a reasonable choice for most datasets. A very high value of Nd and Na may suffer from overfitting and yield poor generalization.

An optimal choice of γ can have a major role on the overall performance. Typically a larger N_steps value favors for a larger γ.

A large batch size is beneficial for performance — if the memory constraints permit, as large as 1–10 % of the total training dataset size is suggested. The virtual batch size is typically much smaller than the batch size.

Initially large learning rate is important, which should be gradually decayed until convergence.

Results

I’ve tried TabNet via this command line interface for several datasets, including the Adult Census dataset that I used in the post about NODE and CatBoost for reasons that can be found in that post. Conveniently, this dataset had also been used in the TabNet manuscript, and the authors present the best parameter settings they found there. With repeated runs using those setting, I noticed that the best validation error (and test error) tends to be at around 86%, similar to CatBoost without hyperparameter tuning. The authors report a test set performance of 85.7% in the manuscript. When I did hyperparameter optimization with hyperopt, I unsurprisingly reached a similar performance around 86%, albeit with a different parameter setting.

For other datasets such as the Poker Hand dataset, TabNet is claimed to beat other methods by a considerable margin. I have not yet devoted much time to that, but everyone is of course invited to try TabNet with hyperparameter optimization on various datasets for themselves!

Conclusions

TabNet is an interesting architecture that seems promising for tabular data analysis. It operates directly on raw data and uses a sequential attention mechanism to perform explicit feature selection for each example. This property also gives it a sort of built-in interpretability.

I have tried to make TabNet slightly easier to work with by writing some wrapper code around it. The next step is to compare it to other methods across a wide range of datasets.

Please try it on your own datasets and/or send pull requests and help me improve the interface if you are interested!


Modelling tabular data with CatBoost and NODE

CatBoost from Yandex, a Russian online search company, is fast and easy to use, but recently researchers from the same company released a new neural network based package, NODE, that they claim outperforms CatBoost and all other gradient boosting methods. Can this be true? Let’s find out how to use both CatBoost and NODE!

Who is this blog post for?

Although I wrote this blog post for anyone who is interested in machine learning and in particular tabular data, it is helpful if you are familiar with Python and the scikit-learn library if you want to follow along with the code. If you aren’t, hopefully you will find the theoretical and conceptual parts interesting anyway!

CatBoost introduction

CatBoost is my go-to package for modelling tabular data. It is an implementation of gradient boosted decision trees with a few tweaks that make it slightly different from e.g. xgboost or LightGBM. It works for both classification and regression problems.

Some nice things about CatBoost:

  • It handles categorical features (get it?) out of the box, so you don’t need to worry about how to encode them.
  • It typically requires very little parameter tuning.
  • It avoids certain subtle types of data leakage that other methods may suffer from. 
  • It is fast, and can be run on GPU if you want it to go even faster.

These factors make CatBoost, for me, a no-brainer as the first thing to reach for when I need to analyze a new tabular dataset.

Technical details of CatBoost

Skip this section if you just want to use CatBoost!

On a more technical level, there are some interesting things about how CatBoost is implemented. I highly recommend the paper Catboost: unbiased boosting with categorical features if you are interested in the details. I just want to highlight two things.

  1. In the paper, the authors show that standard gradient boosting algorithms are affected by subtle types of data leakage which result from the way that the models are iteratively fitted. In a similar manner, the most effective ways to encode categorical features numerically (like target encoding) are prone to data leakage and overfitting. To avoid this leakage, CatBoost introduces an artificial timeline according to which the training examples arrive, so that only “previously seen” examples can be used when calculating statistics.
  2. CatBoost actually doesn’t use regular decision trees, but oblivious decision trees. These are trees where, at each level of the tree, the same feature and the same splitting criterion is used everywhere! This sounds weird, but has some nice properties. Let’s look at what is meant by this.
Left: Regular decision tree. Any feature or split point can be present at each level. Right: Oblivious decision tree. Each level has the same splits.

In a normal decision tree, feature to split on and the cutoff value both depend on what path you have taken so far in the tree. This makes sense, because we can use the information we already have to decide the most informative next question (like in the “20 questions” game). With oblivious decision trees, the history doesn’t matter; we pose the same question no matter what. The trees are called “oblivious” because they keep “forgetting” what has happened before. 

Why is this useful? One nice property of oblivious decision trees is that an example can be classified or scored really quickly – it is always the same N binary questions that are posed (where N is the depth of the tree). This can easily be done in parallel for many examples. That is one reason why CatBoost is fast. Another thing to keep in mind is that we are dealing with a tree ensemble here. As a stand-alone algorithm, the oblivious decision tree might not work so well, but the idea of tree ensembles is that a coalition of weak learners often works well because errors and biases are “washed out”. Normally, the weak learner is a standard decision tree, and here it is something even weaker, namely the oblivious decision tree. The CatBoost authors argue that this particular weak base learner works well for generalization.

Installing CatBoost

Although installing CatBoost should be a simple matter of typing

pip install catboost

I’ve sometimes encountered problems with that when on a Mac. On Linux systems such as the Ubuntu system I am typing on now, or on Google Colaboratory, it should “just work”. If you keep having problems installing it, consider using a Docker image, e.g.

docker pull yandex/tutorial-catboost-clickhouse
docker run -it yandex/tutorial-catboost-clickhouse

Using CatBoost on a dataset

Link to Colab notebook with code

Let’s have a look at how to use CatBoost on a tabular dataset. We start by downloading a lightly preprocessed version of the Adult/Census Income  dataset which is, in the following, assumed to be located in datasets/adult.csv. I chose this dataset because it has a mix of categorical and numerical features, a nice manageable size in the tens of thousands of examples and not too many features. It is often used to exemplify algorithms, for instance in Google’s What-If Tool and many other places.  

The adult census dataset has the columns ‘age’, ‘workclass’, ‘education’, ‘education-num’, ‘marital-status’, ‘occupation’, ‘relationship’, ‘race’, ‘sex’, ‘capital-gain’, ‘capital-loss’, ‘hours-per-week’, ‘native-country’, and ‘<=50K‘. The task is to predict the value of the last column, ‘<=50K’, which indicates if the person in question earns 50,000 USD or less per year (the dataset is from 1994). We regard the following features as categorical rather than numerical: ‘workclass’, ‘education’, ‘marital-status’, ‘occupation’, ‘relationship’, ‘race’, ‘sex’, ‘native-country’.

The code is pretty similar to scikit-learn except for the Pool datatype that CatBoost uses to bundle feature and target values for a dataset while keeping them conceptually separate. (I have to admit I don’t really know why Pool is there – I just use it, and it seems to work fine.)

The code is available on Colab, but I will copy it here for reference. CatBoost needs to know which features are categorical and will then handle them automatically. In this code snippet, I also use 5-fold (stratified) cross-validation to estimate the prediction accuracy.

from catboost import CatBoostClassifier, Pool
from hyperopt import fmin, hp, tpe
import pandas as pd
from sklearn.model_selection import StratifiedKFold

df = pd.read_csv("https://docs.google.com/uc?" + 
                 "id=10eFO2rVlsQBUffn0b7UCAp28n0mkLCy7&" + 
                 "export=download")
labels = df.pop('<=50K')

categorical_names = ['workclass', 'education', 'marital-status',
                     'occupation', 'relationship', 'race',
                     'sex', 'native-country']  
categoricals = [df.columns.get_loc(i) for i in categorical_names]

nfolds = 5
skf = StratifiedKFold(n_splits=nfolds, shuffle=True)
acc = []

for train_index, test_index in skf.split(df, labels):
  X_train, X_test = df.iloc[train_index].copy(), \
                    df.iloc[test_index].copy()
  y_train, y_test = labels.iloc[train_index], \
                    labels.iloc[test_index]
  train_pool = Pool(X_train, y_train, cat_features = categoricals)
  test_pool = Pool(X_test, y_test, cat_features = categoricals)
  model = CatBoostClassifier(iterations=100,
                             depth=8,
                             learning_rate=1,
                             loss_function='MultiClass') 
  model.fit(train_pool)
  predictions = model.predict(test_pool)
  accuracy = sum(predictions.squeeze() == y_test) / len(predictions)
  acc.append(accuracy)

mean_acc = sum(acc) / nfolds
print(f'Mean accuracy based on {nfolds} folds: {mean_acc:.3f}')
print(acc)

What we tend to get from running this (CatBoost without hyperparameter optimization) is a mean accuracy between 85% and 86%. In my last run, I got about 85.7%.

If we want to try to optimize the hyperparameters, we can use hyperopt (if you don’t have it, install it with pip install hyperopt). In order to use it, you need to define a function that hyperopt tries to minimize. We will just try to optimize the accuracy here. Perhaps it would be better to optimize e.g. log loss, but that is left as an exercise to the reader 😉 

The main parameters to optimize are probably the number of iterations, the learning rate, and the tree depth. There are also many other parameters related to over-fitting, for instance early stopping rounds and so on. Feel free to explore on your own!

# Optimize between 10 and 1000 iterations and depth between 2 and 12

search_space = {'iterations': hp.quniform('iterations', 10, 1000, 10),
                'depth': hp.quniform('depth', 2, 12, 1),
                'lr': hp.uniform('lr', 0.01, 1)
               }

def opt_fn(search_space):

  nfolds = 5
  skf = StratifiedKFold(n_splits=nfolds, shuffle=True)
  acc = []

  for train_index, test_index in skf.split(df, labels):
    X_train, X_test = df.iloc[train_index].copy(), \
                      df.iloc[test_index].copy()
    y_train, y_test = labels.iloc[train_index], \
                      labels.iloc[test_index]
    train_pool = Pool(X_train, y_train, cat_features = categoricals)
    test_pool = Pool(X_test, y_test, cat_features = categoricals)

    model = CatBoostClassifier(iterations=search_space['iterations'],
                             depth=search_space['depth'],
                             learning_rate=search_space['lr'],
                             loss_function='MultiClass',
                             od_type='Iter')

    model.fit(train_pool, logging_level='Silent')
    predictions = model.predict(test_pool)
    accuracy = sum(predictions.squeeze() == y_test) / len(predictions)
    acc.append(accuracy)

  mean_acc = sum(acc) / nfolds
  return -1*mean_acc

best = fmin(fn=opt_fn, 
            space=search_space, 
            algo=tpe.suggest, 
            max_evals=100)

When I last ran this code, it took over 5 hours but resulted in a mean accuracy of 87.3%, which is on par with the best results I got when trying the Auger.ai AutoML platform.

Sanity check: logistic regression

At this point we should ask ourselves if these fancy new-fangled methods are really needed. How would a good old logistic regression perform out of the box and after hyperparameter optimization?

I’ll omit reproducing the code here for brevity’s sake, but it is available in the same Colab notebook as before. One detail with the logistic regression implementation is that it doesn’t handle categorical variables out of the box like CatBoost does, so I decided to code them using target encoding, specifically leave-one-out target encoding, which is the approach taken in NODE and a fairly close though not identical analogue of what happens in CatBoost.

Long story short, untuned logistic regression with this type of encoding yields around 80% accuracy, and around 81% (80.7% in my latest run) after hyperparameter tuning. Here, an interestin alternative is to try automated preprocessing libraries such as vtreat and Automunge, but I will save those for an upcoming blog post!

Taking stock

What do we have so far, before trying NODE?

  • Logistic regression, untuned: 80.0%
  • Logistic regression, tuned: 80.7%
  • CatBoost, untuned: 85.7%
  • CatBoost, tuned: 87.2%


NODE: Neural Oblivious Decision Ensembles

A recent manuscript from Yandex researchers describes an interesting neural network version of CatBoost, or at least a neural network take on oblivious decision tree ensembles (see the technical section above if you want to remind yourself what “oblivious” means here.) This architecture, called NODE, can be used for either classification or regression.

One of the claims from the abstract reads: “With an extensive experimental comparison to the leading GBDT packages on a large number of tabular datasets, we demonstrate the advantage of the proposed NODE architecture, which outperforms the competitors on most of the tasks.” This naturally piqued my interest. Could this tool be better than CatBoost?

How does NODE work?

You should go to the paper for the full story, but some relevant details are:

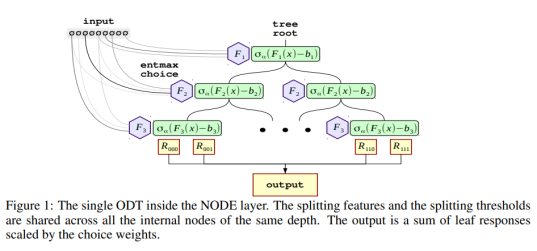
  • The entmax activation function is used as a soft version of a split in a regular decision tree. As the paper puts it, The entmax is capable to produce sparse probability distributions, where the majority of probabilities are exactly equal to 0. In this work, we argue that entmax is also an appropriate inductive bias in our model, which allows differentiable split decision construction in the internal tree nodes. Intuitively, entmax can learn splitting decisions based on a small subset of data features (up to one, as in classical decision trees), avoiding undesired influence from others.” The entmax functions allows a neural network to mimic a decision tree-type system while keeping the model differentiable (weights can be updated based on the gradients).
  • The authors present a new type of layer, a “node layer”, which you can use in a neural network (their implementation is in PyTorch). A node layer represents a tree ensemble.
  • Several node layers can be stacked, yielding a hierarchical model where the input is fed through one tree ensemble at a time. Successive concatenation of input representations can be used to give a model which is reminiscent of the popular DenseNet model for image processing, just specialized in tabular data.
  • The parameters of a NODE model are:
    • Learning rate (always 0.001 in the paper)
    • The number of node layers (k)
    • The number of trees in each layer (m)
    • The depth of the trees in each layer (d)


How is NODE related to tree ensembles?

To get a feeling for how the analogy between this neural network architecture and decision tree ensembles looks, Figure 1 is reproduced here.

Screenshot from 2020-01-12 16-34-38

How should the parameters be chosen?

There is not much guidance in the manuscript; the authors suggest using hyperparameter optimization. They do mention that they optimize over the following space:

  • num layers: {2, 4, 8} 
  • total tree count: {1024, 2048} 
  • tree depth: {6, 8} 
  • tree output dim: {2, 3}

In my code, I don’t do grid search but rather let hyperopt sample values within certain ranges. The way I thought about it (which could be wrong) is that each layer represents a tree ensemble (a single instance of CatBoost, let’s say). For each layer that you add, you may add some representation power, but you also make the model much heavier to train and potentially risk overfitting. The total tree count seems roughly analogous to the number of trees in CatBoost/xgboost/random forests, and has the same tradeoffs: with many trees, you can express more complicated functions, but the model will take much longer to train and risk overfitting. The tree depth, again, has the same type of tradeoff. As for the output dimensionality, frankly, I don’t quite understand why it is a parameter. Reading the paper, it seems it should be equal to one for regression and equal to the number of classes for classification.

How does one use NODE?

The authors have made code available on GitHub. They do not provide a command-line interface but rather suggest that users run their models in the provided Jupyter notebooks. One classification example and one regression example is provided in those notebooks.

The repo README page also strongly suggests using a GPU to train NODE models. (This is a factor in favor of CatBoost.) 

I have prepared a Colaboratory notebook with some example code on how to run classification on NODE and how to optimize hyperparameters with hyperopt. 

Please move to the Colaboratory notebook right now to keep following along! 

Here I will just highlight some parts of the code.

General problems adapting the code

The problems I encountered when adapting the authors’ code were mainly related to data types. It’s important that the input datasets (X_train and X_val) are arrays (numpy or torch) in float32 format; not float64 or a mix of float and int. The labels need to be encoded as long (int64) for classification, and float32 for regression. (You can see this handled in the cell titled “Load, split and preprocess the data”.)

Other problems were related to memory. The models can quickly blow up the GPU memory, especially with the large batch sizes used in the authors’ example notebooks. I solved this simply by using the maximum batch size I could get away with on my laptop (and later, on Colab).

In general, though, it was not that hard to get the code to work. The documentation was a bit sparse, but sufficient.


Categorical variable handling

Unlike CatBoost, NODE does not support categorical variables, so you have to prepare those yourself into a numerical format. We do it for the Adult Census dataset in the same way the NODE authors do it, using LeaveOneOutEncoder from the category_encoders library. Here we just use a regular train/test split instead of 5-fold CV out of convenience, as it takes a long time to train NODE (especially with hyperparameter optimization).

from category_encoders import LeaveOneOutEncoder
import numpy as np
import pandas as pd
from sklearn.model_selection import train_test_split

df = pd.read_csv('https://docs.google.com/uc' + 
                 '?id=10eFO2rVlsQBUffn0b7UCAp28n0mkLCy7&' + 
                 'export=download')
labels = df.pop('<=50K')
X_train, X_val, y_train, y_val = train_test_split(df,
                                                  labels,
                                                  test_size=0.2)

class_to_int = {c: i for i, c in enumerate(y_train.unique())}                                                                                                               
y_train_int = [class_to_int[v] for v in y_train]                                                                                                                            
y_val_int = [class_to_int[v] for v in y_val] 

cat_features = ['workclass', 'education', 'marital-status',
                'occupation', 'relationship', 'race', 'sex',
                'native-country']
  
cat_encoder = LeaveOneOutEncoder()
cat_encoder.fit(X_train[cat_features], y_train_int)
X_train[cat_features] = cat_encoder.transform(X_train[cat_features])
X_val[cat_features] = cat_encoder.transform(X_val[cat_features])

# Node is going to want to have the values as float32 at some points
X_train = X_train.values.astype('float32')
X_val = X_val.values.astype('float32')
y_train = np.array(y_train_int)
y_val = np.array(y_val_int)

Now we have a fully numeric dataset. 

Model definition and training loop

The rest of the code is essentially the same as in the authors’ repo (except for the hyperopt part). They created a Pytorch layer called DenseBlock, which implements the NODE architecture. A class called Trainer holds information about the experiment, and there is a straightforward training loop that keeps track of the best metrics seen so far and plots updated loss curves.

Results & conclusions

With some minimal trial and error, I was able to find a model with around 86% validation accuracy. After hyperparameter optimization with hyperopt (which was supposed to run overnight on a GPU in Colab, but in fact timed out after about 40 iterations), the best performance was 87.2%. In other runs I have achieved 87.4%. In other words, NODE did outperform CatBoost, albeit slightly, after hyperopt tuning.

However, accuracy is not everything. It is not convenient to have to do costly optimization for every dataset. 

Pros of NODE vs CatBoost:

  • It seems that slightly better results can be obtained (based on the NODE paper and this test; I will be sure to try many other datasets!)

Pros of CatBoost vs NODE:

  • Much faster
  • Less need of hyperparameter optimization
  • Runs fine without GPU
  • Has support for categorical variables

Which one would I use for my next projects? Probably CatBoost will still be my go-to tool, but I will keep NODE in mind and maybe try it just in case…

It’s also important to realize that performance is dataset-dependent and that the Adult Census Income dataset is not representative of all scenarios. Perhaps more importantly, the preprocessing of categorical features is likely rather important in NODE. I’ll return to the subject of preprocessing in a future post!


Explaining and interpreting predictive models

A couple of years ago, I participated in a workshop on academic data science at SICS in Stockholm. At that event, we discussed various trends in data science and machine learning and at the end of it, I participated in a discussion group, led by professor Niklas Lavesson from Blekinge Institute of Technology, where we talked about model interpretability and explanation. At the time, it felt like a fringe but interesting topic. Today, this topic seems to be all over the place. Here are some of the places I’ve seen it recently.

Blog posts and presentations

Interpretable Machine Learning: The fuss, the concrete and the questions (pdf link). This 125-page (!) presentation is from a tutorial given at ICML 2017 in Sydney the other day. It gives a useful overview of how to think about interpretability in machine learning.

Ideas on interpreting machine learning. This is a very thorough blog post from O’Reilly with a lot of good ideas. It also talks about related things such as dimensionality reduction which I would not call model explanation per se, but which are still good to know.

Fast Forward Labs have announced a new report on interpretable machine learning. (I have not read the actual report.)

Papers with software

Understanding Black-box Predictions via Influence Functions. The paper of this name (associated code here) won a best-paper award at ICML 2017 (again showing how hot this topic is!). The authors use something called an influence function to quantify, roughly speaking, how much a perturbation of a single example in the training data set affects the resulting model. In this way, they can identify the training data points most responsible for a given prediction. One might say that they have figured out a way to differentiate a predictive model with respect to data points in the training set.

LIME, Local Interpretable Model-agnostic Explanations. (arXiv link, code on Github) This has been around for more than a year and can thus be called “established” in the rapidly changing world of machine learning. I have tried it myself for a consulting gig and found it useful for understanding why a certain prediction was made. The main implementation is in Python but there is also a good R port (which is what I used when I tried it.) LIME essentially builds a simplified local model around the data point you are interested in. It does this by perturbing real training data points, obtaining the predicted label for those perturbed points, and fitting a sparse linear model to those points and labels. (As far as I have understood, that is!)

I’m sure I have missed a lot of interesting work.

If anyone is interested, I might write another blog post illustrating how LIME can be used to understand why a certain prediction was made on a public dataset. I might even try to explain the influence function paper if I get the time to try it and digest the math.

Dynamics in Swedish Twitter communities

TL;DR

I made a community decomposition of Swedish Twitter accounts in 2015 and 2016 and you can explore it in an online app.

Background

As reported on this blog a couple of months ago, (and also here). I have (together with Mattias Östmar) been investigating the community structure of Swedish Twitter users. The analysis we posted then addressed data from 2015 and we basically just wanted to get a handle on what kind of information you can get from this type of analysis.

With the processing pipeline already set up, it was straightforward to repeat the analysis for the fresh data from 2016 as soon as Mattias had finished collecting it. The nice thing about having data from two different years in that we can start to look at the dynamics – namely, how stable communities are, which communities are born or disappear, and how people move between them.

The app

First of all, I made an app for exploring these data. If you are interested in this topic, please help me understand the communities that we have detected by using the “Suggest topic” textbox under the “Community info” tab. That is an attempt to crowdsource the “annotation” of these communities. The suggestions that are submitted are saved in a text file which I will review from time to time and update the community descriptions accordingly.

The fastest climbers

By looking at the data in the app, we can find out some pretty interesting things. For instance, the account that easily increased to most in influence (measured in PageRank) was @BjorklundVictor, who climbed from a rank of 3673 in 2015 in community #4 (which we choose to annotate as an “immigration” community) to a rank of 3 (!) in community #4 in 2016 (this community has also been classified as an immigration-discussion community, and it is the most similar one of all 2016 communities to the 2015 immigration community.) I am not personally familiar with this account, but he must have done something to radically increase his reach in 2016.

Some other people/accounts that increased a lot in influence were professor Agnes Wold (@AgnesWold) who climbed from rank 59 to rank 3 in the biggest community, which we call the “pundit cluster” (it has ID 1 both in 2015 and 2016), @staffanlandin, who went from #189 to #16 in the same community, and @PssiP, who climbed from rank 135 to rank 8 in the defense/prepping community (ID 16 in 2015, ID 9 in 2016).

Some people have jumped to a different community and improved their rank in that way, like @hanifbali, who went from #20 in community 1 (general punditry) in 2015 to the top spot, #1 in the immigration cluster (ID 4) in 2016, and @fleijerstam, who went from #200 in the pundit community in 2015 to #10 in the politics community (#3) in 2016.

Examples of users who lost a lot of ground in their own community are @asaromson (Åsa Romson, the ex-leader of the Green Party; #7 -> #241 in the green community) and @rogsahl (#10 -> #905 in the immigration community).

The most stable communities

It turned out that the most stable communities (i.e. the communities that had the most members in common relative to their total sizes in 2015 and 2016 respectively) were the ones containing accounts using a different language from Swedish, namely the Norwegian, Danish and Finnish communities.

The least stable community

Among the larger communities in 2015, we identified the one that was furthest from having a close equivalent in 2016. This was 2015 community 9, where the most influential account was @thefooomusic. This is a boy band whose popularity arguably hit a peak in 2015. The community closest to it in 2016 is community 24, but when we looked closer at that (which you can also do in the app!), we found that many YouTube stars had “migrated” into 2016 cluster 24 from 2015 cluster 84, which upon inspection turned out to be a very clear Swedish YouTuber cluster with stars such as Clara Henry, William Spetz and Therese Lindgren.

So in other words, the The Fooo fan cluster and the YouTuber cluster from 2015 merged into a mixed cluster in 2016.

New communities

We were hoping to see some completely new communities appear in 2016, but that did not really happen, at least not for the top 100 communities. Granted, there was one that had an extremely low similarity to any 2015 community, but that turned out to be a “community” topped by @SJ_AB, a railway company that replies to a large number of customer queries and complaints on Twitter (which, by the way, makes it the top account of them all in terms of centrality.) Because this company is responding to queries from new people all the time, it’s not really part of a “community” as such, and the composition of the cluster will naturally change a lot from year to year.

Community 24, which was discussed above, was also dissimilar from all the 2015 communitites, but as described, we notice it has absorbed users from 2015 clusters 9 (The Fooo) and 84 (YouTubers).

Movement between the largest communities

The similarity score for the “pundit clusters” (community 1 in 2015 and community 1 in 2016, respectively) somewhat surprisingly showed that these were not very similar overall, although many of the top-ranked users are the same. A quick inspection also showed that the entire top list of community 3 in 2015 moved to community 1 in 2016, which makes the 2015 community 3 the closest equivalent to the 2016 community 1. Both of these communities can be characterized as general political discussion/punditry clusters.

Comparison: The defense/prepper community in 2015 vs 2016

In our previous blog post on this topic, we presented a top-10 list of defense Twitterers and compared that to a manually curated list from Swedish daily Svenska Dagbladet. Here we will present our top-10 list for 2016.

Username Rank in 2016 Rank in 2015 Community ID in 2016 Community ID in 2015
patrikoksanen 1 3 9 16
hallonsa 2 5 9 16
Cornubot 3 1 9 16
waterconflict 4 6 9 16
wisemanswisdoms 5 2 9 16
JohanneH 6 9 9 16
mikaelgrev 7 7 9 16
PssiP 8 135 9 16
oplatsen 9 11 9 16
stakmaskin 10 31 9 16

Comparison: The green community in 2015 vs 2016

One community we did not touch on in the last blog post is the green, environmental community. Here’s a comparison of the main influencers in that category in 2016 vs 2015.

Username Rank in 2016 Rank in 2015 Community ID in 2016 Community ID in 2015
rickardnordin 1 4 13 29
Ekobonden 2 1 13 109
ParHolmgren 3 19 13 29
BjornFerry 4 12 13 133
PWallenberg 5 12 13 109
mattiasgoldmann 6 3 13 29
JKuylenstierna 7 10 13 29
Axdorff 8 3 13 153
fores_sverige 9 11 13 29
GnestaEmma 10 17 13 29

Caveats

Of course, many parts of this analysis could be improved and there are some important caveats. For example, the Infomap algorithm is not deterministic, which means that you are likely to get somewhat different results each time you run it. For these data, we have run it a number of times and seen that you get results that are similar in a general sense each time (in terms of community sizes, top influencers and so on), but it should be understood that some accounts (even top influencers) can in some cases move around between communities just because of this non-deterministic aspect of the algorithm.

Also, it is possible that the way we use to measure community similarity (the Jaccard index, which is the ratio between the number of members in common between two communities and the number of members that are in any or both of the communities – or to put it in another way, the intersection divided by the union) is too coarse, because it does not consider the influence of individual users.

Swedish school fires and Kaggle open data

For quite a while now, I have been rather mystified and intrigued by the fact that Sweden has one of the highest rates of school fires due to arson. According to the Division of Fire Safety Engineering at Lund University, “Almost every day between one and two school fires occur in Sweden. In most cases arson is the cause of the fire.” This is a lot for a small country with less than 10 million inhabitants, and the associated costs can be up to a billion SEK (around 120 million USD) per year.

It would be hard to find a suitable dataset to address the question why arson school fires are so frequent in Sweden compared to other countries in a data-driven way – but perhaps it would be possible to stay within a Swedish context and find out which properties and indicators of Swedish towns (municipalities, to be exact) might be related to a high frequency of school fires?

To answer this question, I  collected data on school fire cases in Sweden between 1998 and 2014 through a web site with official statistics from the Swedish Civil Contingencies Agency. As there was no API to allow easy programmatic access to schools fire data, I collected them by a quasi-manual process, downloading XLSX report generated from the database year by year, after which I joined these with an R script into a single table of school fire cases where the suspected reason was arson. (see Github link below for full details!)

To complement  these data, I used a list of municipal KPI:s (key performance indicators) from 2014, that Johan Dahlberg put together for our contribution in Hack for Sweden earlier this year. These KPIs were extracted from Kolada (a database of Swedish municipality and county council statistics) by repeatedly querying its API.

There is a Github repo containing all the data and detailed information on how it was extracted.

The open Kaggle dataset lives at https://www.kaggle.com/mikaelhuss/swedish-school-fires. So far, the process of uploading and describing the data has been smooth. I’ve learned that each Kaggle dataset has an associated discussion forum, and (potentially) a bunch of “kernels”, which are analysis scripts or notebooks in Python, R or Julia. I hope that other people will contribute script and analyses based on these data. Please do if you find this dataset intriguing!

Cumulative biology and meta-analysis of gene expression data

In talks that I have given in the past few years, I have often made the point that most of genomics has not been “big data” in the usual sense, because although the raw data files can often be large, they are often processed in a more or less predictable way until they are “small” (e.g., tables of gene expression measurements or genetic variants in a small number of samples). This in turn depends on the fact that it is hard and expensive to obtain biological samples, so in a typical genomics project the sample size is small (from just a few to tens or in rare cases hundreds or thousands) while the dimensionality is large (e.g. 20,000 genes, 10,000 proteins or a million SNPs). This is in contrast to many “canonical big data” scenarios where one has a large number of examples (like product purchases) with a small dimensionality (maybe the price, category and some other properties of the product.)

Because of these issues, I have been hopeful about using published data on e.g. gene expression based on RNA sequencing or on metagenomics to draw conclusions based on data from many studies. In the former case (gene expression/RNA-seq) it could be to build classifiers for predicting tissue or cell type for a given gene expression profile. In the latter case (metagenomics/metatranscriptomics, maybe even metaproteomics) it could also be to build classifiers but also to discover completely new varieties of e.g. bacteria or viruses from the “biological dark matter” that makes up a large fraction of currently generated metagenomics data. These kinds of analysis are usually called meta-analysis, but I am fond of the term cumulative biology, which I came across in a paper by Samuel Kaski and colleagues (Toward Computational Cumulative Biology by Combining Models of Biological Datasets.)

Of course, there is nothing new about meta-analysis or cumulative biology – many “cumulative” studies have been published about microarray data – but nevertheless, I think that some kind of threshold has been crossed when it comes to really making use of the data deposited in public repositories. There has been development both in APIs allowing access to public data, in data structures that have been designed to deal specifically with large sequence data, and in automating analysis pipelines.

Below are some interesting papers and packages that are all in some way related to analyzing public gene expression data in different ways. I annotate each resource with a couple of tags.

Sequence Bloom Trees. [data structures] These data structures (described in the paper Fast search of thousands of short-read sequencing experiments) allow indexing of a very large number of sequences into a data structure that can be rapidly queried with your own data. I first tried it about a year ago and found it to be useful to check for the presence of short snippets of interest (RNA sequences corresponding to expressed peptides of a certain type) in published transcriptomes. The authors have made available a database of 2,652 RNA-seq experiments from human brain, breast and blood which served as a very useful reference point.

The Lair. [pipelines, automation, reprocessing] Lior Pachter and the rest of the gang behind popular RNA-seq analysis tools Kallisto and Sleuth have taken their concept further with Lair, a platform for interactive re-analysis of published RNA-seq datasets. They use a Snakemake based analysis pipeline to process and analyze experiments in a consistent way – see the example analyses listed here. Anyone can request a similar re-analysis of a published data set by providing a config file, design matrix and other details as described here.

Toil. [pipelines, automation, reprocessing] The abstract of this paper, which was recently submitted to bioRxiv, states: Toil is portable, open-source workflow software that supports contemporary workflow definition languages and can be used to securely and reproducibly run scientific workflows efficiently at large-scale. To demonstrate Toil, we processed over 20,000 RNA-seq samples to create a consistent meta-analysis of five datasets free of computational batch effects that we make freely available. Nearly all the samples were analysed in under four days using a commercial cloud cluster of 32,000 preemptable cores. The authors used their workflow software to quantify expression in  four studies: The Cancer Genome Atlas (TCGA), Therapeutically Applicable Research To Generate Effective Treatments (TARGET), Pacific Pediatric Neuro-Oncology Consortium (PNOC), and the Genotype Tissue Expression Project (GTEx).

EBI’s RNA-seq-API. [API, discovery, reprocessing, compendium] The RESTful RNA-seq Analysis API provided by the EBI currently contains raw, FPKM and TPM gene and exon counts for a staggering 265,000 public sequencing runs in 264 different species, as well as ftp locations of CRAM, bigWig and bedGraph files. See the documentation here.

Digital Expression Explorer. [reprocessing, compendium] This resource contains hundreds of thousands of uniformly processed RNA-seq data sets (e.g., >73,000 human data sets and >97,000 mouse ones). The data sets were processed into gene-level counts, which led to some Twitter debate between the transcript-level quantification hardliners and the gene-count-tolerant communities, if I may label the respective camps in that way. These data sets can be downloaded in bulk.

CompendiumDb. [API, discovery] This is an R package that facilitates the programmatic retrieval of functional genomics data (i.e., often gene expression data) from the Gene Expression Omnibus (GEO), one of the main repositories for this kind of data.

Omics Discovery Index (OmicsDI). [discovery] This is described as a “Knowledge Discovery framework across heterogeneous data (genomics, proteomics and metabolomics)” and is mentioned here both because a lot of it is gene expression data and because it seems like a good resource for finding data across different experimental types for the same conditions.

MetaRNASeq. [discovery] A browser-based query system for finding RNA-seq experiments that fulfill certain search criteria. Seems useful when looking for data sets from a certain disease state, for example.

Tradict. [applications of meta-analysis] In this study, the authors analyzed 23,000 RNA-seq experiments to find out whether gene expression profiles could be reconstructed from a small subset of just 100 marker genes (out of perhaps 20,000 available genes). The author claims that it works well and the manuscript contains some really interesting graphs showing, for example, how most of the variation in gene expression is driven by developmental stage and tissue.

In case you think that these types of meta-analysis are only doable with large computing clusters with lots of processing power and storage, you’ll be happy to find out that it is easy to analyze RNA-seq experiments in a streaming fashion, without having to download FASTQ or even BAM files to disk (Valentine Svensson wrote a nice blog post about this), and with tools such as Kallisto, it does not really take that long to quantify the expression levels in a sample.

Finally, I’ll acknowledge that the discovery-oriented tools above (APIs, metadata search etc) still work on the basis of knowing what kind of data set you are looking for. But another interesting way of searching for expression data would be querying by content, that is, showing a search system the data you have at hand and asking it to provide the data sets most similar to it. This is discussed in the cumulative biology paper mentioned at the start of this blog post: “Instead of searching for datasets that have been described similarly, which may not correspond to a statistical similarity in the datasets themselves, we would like to conduct that search in a data-driven way, using as the query the dataset itself or a statistical (rather than a semantic) description of it.” In a similar vein, Titus Brown has discussed using MinHash signatures for identifying similar samples and finding collaborators.

List of deep learning implementations in biology

[Note: this list now lives at GitHub, where it will be continuously updated, so please go there instead!]

I’m going to start collecting papers on, and implementations of, deep learning in biology (mostly genomics, but other areas as well) on this page. It’s starting to get hard to keep up! For the purposes of this list, I’ll consider things like single-layer autoencoders, although not literally “deep”, to qualify for inclusion. The categorizations will by necessity be arbitrary and might be changed around from time to time.

In parallel, I’ll try to post some of these on gitxiv as well under the tag bioinformatics plus other appropriate tags.

Please let me know about the stuff I missed!

Cheminformatics

Neural graph fingerprints [github][gitxiv]

A convolutional net that can learn features which are useful for predicting properties of novel molecules; “molecular fingerprints”. The net works on a graph where atoms are nodes and bonds are edges. Developed by the group of Ryan Adams, who co-hosts the very good Talking Machines podcast.

Proteomics

Pcons2 – Improved Contact Predictions Using the Recognition of Protein Like Contact Patterns [web interface]

Here, a “deep random forest” with five layers is used to improve predictions of which residues (amino acids) in a protein are physically interacting which each other. This is useful for predicting the overall structure of the protein (a very hard problem.)

Genomics

Gene expression

In modeling gene expression, the inputs are typically numerical values (integers or floats) estimating how much RNA is produced from a DNA template in a particular cell type or condition.

ADAGE – Analysis using Denoising Autoencoders of Gene Expression [github][gitxiv]

This is a Theano implementation of stacked denoising autoencoders for extracting relevant patterns from large sets of gene expression data, a kind of feature construction approach if you will. I have played around with this package quite a bit myself. The authors initially published a conference paper applying the model to a compendium of breast cancer (microarray) gene expression data, and more recently posted a paper on bioRxiv where they apply it to all available expression data (microarray and RNA-seq) on the pathogen Pseudomonas aeruginosa. (I understand that this manuscript will soon be published in a journal.)

Learning structure in gene expression data using deep architectures [paper]

This is also about using stacked denoising autoencoders for gene expression data, but there is no available implementation (as far as I could tell). Included here for the sake of completeness (or something.)

Gene expression inference with deep learning [github][paper]

This deals with a specific prediction task, namely to predict the expression of specified target genes from a panel of about 1,000 pre-selected “landmark genes”. As the authors explain, gene expression levels are often highly correlated and it may be a cost-effective strategy in some cases to use such panels and then computationally infer the expression of other genes. Based on Pylearn2/Theano.

Learning a hierarchical representation of the yeast transcriptomic machinery using an autoencoder model [paper]

The authors use stacked autoencoders to learn biological features in yeast from thousands of microarrays. They analyze the hidden layer representations and show that these encode biological information in a hierarchical way, so that for instance transcription factors are represented in the first hidden layer.

Predicting enhancers and regulatory regions

Here the inputs are typically “raw” DNA sequence, and convolutional networks (or layers) are often used to learn regularities within the sequence. Hat tip to Melissa Gymrek (http://melissagymrek.com/science/2015/12/01/unlocking-noncoding-variation.html) for pointing out some of these.

DanQ: a hybrid convolutional and recurrent deep neural network for quantifying the function of DNA sequences [github][gitxiv]

Made for predicting the function of non-protein coding DNA sequence. Uses a convolution layer to capture regulatory motifs (i e single DNA snippets that control the expression of genes, for instance), and a recurrent layer (of the LSTM type) to try to discover a “grammar” for how these single motifs work together. Based on Keras/Theano.

Basset – learning the regulatory code of the accessible genome with deep convolutional neural networks [github][gitxiv]

Based on Torch, this package focuses on predicting the accessibility (or “openness”) of the chromatin – the physical packaging of the genetic information (DNA+associated proteins). This can exist in more condensed or relaxed states in different cell types, which is partly influenced by the DNA sequence (not completely, because then it would not differ from cell to cell.)

DeepSEA – Predicting effects of noncoding variants with deep learning–based sequence model [web server][paper]

Like the packages above, this one also models chromatin accessibility as well as the binding of certain proteins (transcription factors) to DNA and the presence of so-called histone marks that are associated with changes in accessibility. This piece of software seems to focus a bit more explicitly than the others on predicting how single-nucleotide mutations affect the chromatin structure. Published in a high-profile journal (Nature Methods).

DeepBind – Predicting the sequence specificities of DNA- and RNA-binding proteins by deep learning [code][paper]

This is from the group of Brendan Frey in Toronto, and the authors are also involved in the company Deep Genomics. DeepBind focuses on predicting the binding specificities of DNA-binding or RNA-binding proteins, based on experiments such as ChIP-seq, ChIP-chip, RIP-seq,  protein-binding microarrays, and HT-SELEX. Published in a high-profile journal (Nature Biotechnology.)

PEDLA: predicting enhancers with a deep learning-based algorithmic framework [code][paper]

This package is for predicting enhancers (stretches of DNA that can enhance the expression of a gene under certain conditions or in a certain kind of cell, often working at a distance from the gene itself) based on heterogeneous data from (e.g.) the ENCODE project, using 1,114 features altogether.

DEEP: a general computational framework for predicting enhancers

Genome-Wide Prediction of cis-Regulatory Regions Using Supervised Deep Learning Methods (and several other papers applying various kinds of deep networks to regulatory region prediction) [code][one paper out of several]

Wyeth Wasserman’s group have made a kind of toolkit (based on the Theano tutorials) for applying different kinds of deep learning architectures to cis-regulatory element (DNA stretches that can modulate the expression of a nearby gene) prediction. They use a specific “feature selection layer” in their nets to restrict the number of features in the models. This is implemented as an additional sparse one-to-one linear layer between the input layer and the first hidden layer of a multi-layer perceptron.

Methylation

Predicting DNA Methylation State of CpG Dinucleotide Using Genome Topological Features and Deep Networks [paper][web server]

This implementation uses a stacked autoencoder with a supervised layer on top of it to predict whether a certain type of genomic region called “CpG islands” (stretches with an overrepresentation of a sequence pattern where a C nucleotide is followed by a G) is methylated (a chemical modification to DNA that can modify its function, for instance methylation in the vicinity of a gene is often but not always related to the down-regulation or silencing of that gene.) This paper uses a network structure where the hidden layers in the autoencoder part have a much larger number of nodes than the input layer, so it would have been nice to read the authors’ thoughts on what the hidden layers represent.

Single-cell applications

CellCnn – Representation Learning for detection of disease-associated cell subsets
[code][paper]

This is a convolutional network (Lasagne/Theano) based approach for “Representation Learning for detection of phenotype-associated cell subsets.” It is interesting because most neural network approaches for high-dimensional molecular measurements (such as those in the gene expression category above) have used autoencoders rather than convolutional nets.

Population genetics

Deep learning for population genetic inference [paper]

No implementation available yet but says an open-source one will be made available soon.

Neuroscience

This is a harder category to populate because a lot of theoretical work on neural networks and deep learning has been intertwined with neuroscience. For example, recurrent neural networks have long been used for modeling e.g. working memory and attention. In this post I am really looking for pure applications of DL rather than theoretical work, although that is extremely interesting.

For more applied DL, I have found

Deep learning for neuroimaging: a validation study [paper]

SPINDLE: SPINtronic deep learning engine for large-scale neuromorphic computing [paper]

I’m sure there are many others. Maybe digging up some seminal neuroscience papers modeling brain areas and functions with different kinds of neural networks would be a worthy topic for a future blog post.


Some interesting new algorithms

Just wanted to note down some new algorithms that I came across for future reference. Haven’t actually tried any of these yet.

  • LIBFMM, a library for Field-aware Factorization machines. Developed by a group at National Taiwan University, this technique has been used to win two Kaggle click-through competitions. (Criteo, Avazu)
  • Random Bits Regression, a “strong general predictor for big data” (paper). “This method first generates a large number of random binary intermediate/derived features based on the original input matrix, and then performs regularized  linear/logistic regression on those intermediate/derived features to predict the outcome.
  • BIDMach, a CPU and GPU-accelerated machine learning library that shows some amazing benchmark results compared to Spark, Vowpal Wabbit, scikit-learn etc.

And another one which is not as new, but which I wanted to highlight because of a nice blog post about interactions and generalization by David Chudzicki:

Deep learning and genomics: the splicing code [and breast cancer features]

Last summer, I wrote a little bit about potential applications of deep learning to genomics. What I had in mind then was (i) to learn a hierarchy of cell types based on single-cell RNA sequencing data (with gene expression measures in the form of integers or floats as inputs) and (ii) to discover features in metagenomics data (based on short sequence snippets; k-mers). I had some doubts regarding the latter application because I was not sure how much the system could learn from short k-mers. Well, now someone has tried deep learning from DNA sequence features!

Let’s back up a little bit. One of many intriguing questions in biology is exactly how splicing works. A lot is known about the rules controlling it but not everything. A recent article in Science, The human splicing code reveals new insights into the genetic determinants of disease (unfortunately paywalled), used a machine learning approach (ensembles of neural networks) to predict splicing events and the effects of single-base mutations on the same using only DNA sequence information as input. Melissa Gymrek has a good blog post on the paper, so I won’t elaborate too much. Importantly though, in this paper the features are still hand-crafted (there are 1393 sequence based features).

In an extension of this work, the same group used deep learning to actually learn the features from the sequence data. Hannes Bretschneider posted this presentation from NIPS 2014 describing the work, and it is very interesting. They used a convolutional network that was able to discover things like the reading frame (the three-nucleotide periodicity resulting from how amino acids are encoded in protein-coding DNA stretches) and known splicing signals.

They have also made available a GPU-accelerated deep learning library for DNA sequence data for Python: Hebel. Right now it seems like only feedforward nets are available (not the convolutional nets mentioned in the talk). I am currently trying to install the package on my Mac.

Needless to say, I think this is a very interesting development and I hope to try this approach on some entirely different problem.

Edit 2015-01-06. Well, what do you know! Just found out that my suggestion (i) has been tried as well. At the currently ongoing PSB’15 conference, Jie Tan has presented work using a denoising autoencoder network to learn a representation of breast cancer gene expression data. The learned features were shown to represent things like tumor vs. normal tissue status, estrogen receptor (ER) status and molecular subtypes. I had thought that there wasn’t enough data yet to support this kind of approach (and even told someone who suggested using The Cancer Genome Atlas [TCGA] data as much at a data science workshop last month – this work uses TCGA data as well as data from METABRIC), and the authors remark in the paper that it is surprising that the method seems to work so well. Previously my thinking was that we needed to await the masses of single-cell gene expression data that are going to come out in the coming years.

Hadley Wickham lecture: ggvis, tidyr, dplyr and much more

Another week, another great meetup. This time, the very prolific Hadley Wickham visited the Stockholm R useR group and talked for about an hour about his new projects.

Perhaps some background is in order. Hadleys PhD thesis (free pdf here) is a very inspiring tour of different aspects of practical data analysis issues, such as reshaping data into a “tidy” for that is easy to work with (he developed the R reshape package for this), visualizing clustering and classification problems (see his classifly, clusterfly, and meifly packages) and creating a consistent language for describing plots and graphics (which resulted in the influential ggplot2 package). He has also made the plyr package as a more consistent version of the various “apply” functions in R. I learned a lot from this thesis.

Today, Hadley talked about several new packages that he has been developing to further improve on his earlier toolkit. He said that in general, his packages become simpler and simpler as he re-defines the basic operations needed for data analysis.

  • The newest one (“I wrote it about four days ago”, Hadley said) is called tidyr (it’s not yet on CRAN but can be installed from GitHub) and provides functions for getting data into the “tidy” format mentioned above. While reshape had the melt and cast commands, tidyr has gather, separate, and spread.
  • dplyr – the “next iteration of plyr”, which is faster and focuses on data frames. It uses commands like select, filter, mutate, summarize, arrange.
  • ggvis – a “dynamic version of ggplot2” which is designed for responsive dynamic graphics, streaming visualization and meant for the web. This looked really nice. For example, you can easily add sliders to a plot so you can change the parameters and watch how the plot changes in real time. ggvis is built on Shiny but provides easier ways to make the plots. You can even embed dynamic ggvis plots in R markdown documents with knitR so that the resulting report can contain sliders and other things. This is obviously not possible with PDFs though. ggvis will be released on CRAN “in a week or so”.

Hadley also highlighted the magrittr package which implements a pipe operator for R (Magritte/pipe … get it? (groan)) The pipe looks like %>% and at first blush it may not look like a big deal, but Hadley made a convincing case that using the pipe together with (for example) dplyr results in code that is much easier to read, write and debug.

Hadley is writing a book, Advanced R (wiki version here), which he said has taught him a lot about the inner workings of R. He mentioned Rcpp as an excellent way to write C++ code and embed it in R packages. The bigvis package was mentioned as a “proof of concept” of how one might visualize big data sets (where the number of data points is larger than the number of pixels on the screen, so it is physically impossible to plot everything and summarization is necessary.)

Post Navigation